Revolutionizing Lithium Extraction
Read the full case - building a bankable, low-cost, fast-to-market, sustainable lithium supply.

Our Planet Is Running Low on Battery

The Environmental Challenge
What Is Happening
- Global GHG emissions reached 53.2 Gt CO₂e in 2024 - +1.3% year over year - the highest on record. The world is already 1.47 °C above pre-industrial levels.
- Power is the largest single source (~29%). Transport is No. 2 (~16%). Combined, they are the fastest lever to bend the curve. Fossil CO₂ is ~74.5% of total GHGs.
Why Is It Happening Now?
- 2024’s record heat drove cooling demand and pushed fossil generation up. The IEA estimates ~230 Mt CO₂ of the 2024 rise came from temperature effects alone.
- Energy demand is still growing. Total energy supply rose to 648 EJ in 2024, and electricity output grew 4.2% to 31,153 TWh. Electrification is real, which makes the battery system critical.
Fastest Path To Real Cuts
- The quickest large-scale reductions come from electrifying transport and building clean power. In 2024, renewables supplied ~75% of global power-generation growth, with solar and wind leading the additions. Battery storage is accelerating to balance the grid.
- None of this scales without an immediate supply of responsibly produced lithium. Clean electrons require clean materials.
Why Lithium Harvest Is Relevant
Decarbonizing power and transportation depends on mineral inputs with low embedded CO₂, water, and land footprints. We turn waste brines into battery-grade lithium, shrinking upstream footprints and multiplying downstream abatement in EVs and grid storage. It’s a force multiplier for the fastest decarbonization lanes.
Global emissions continue to rise, driven by power and transport. The fastest way to cut emissions at scale is to electrify transportation and expand renewables. Low-impact lithium now is a force multiplier for EVs, storage, and renewable build-out.

EVs Aren’t Really Better for the Environment - Or Are They?

How We Make EVs Even Cleaner
“EVs are not really greener, right?” - You hear it all the time.
It is true: building an EV battery adds upfront CO₂, at around 4.7 metric tons per vehicle on average.
- But over their entire lifecycle, EVs cut emissions by ~70% compared to ICE vehicles (16.9 vs. 54.3 metric tons CO₂).
- On a global scale, widespread EV adoption could prevent ~2.6 gigatons of CO₂ by 2035, equal to taking millions of cars off the road.
EVs already win on climate. Supplying low-impact lithium now enables them to win faster and by more, thereby compounding decarbonization across fleets and grids.
Learn more about the EV greenhouse gas emission breakeven point.
How Lithium Harvest turbo-charges those gains:

ICE |

EV (Traditional Mining) |

EV (Lithium Harvest) |

Impact |
|
|---|---|---|---|---|
| Battery CO₂ | - | 4.7 tonne | 2.0 tonne | -57% |
| Lifetime CO₂ | 54.3 tonne | 16.9 tonne | 14.2 tonne | -16% (-74% vs ICE) |
| GHG breakeven vs ICE | - | 11,335 mi/18,243 km | 1,982 mi/3,190 km | 5.72× sooner - 83% fewer km |
| Water saved per car | - | - | 17.6 m³ | >90 water recycling/reuse |
| Land saved per car | - | - | 141 m² | No new pits or ponds |
ICE
EV (Traditional Mining)
EV (Lithium Harvest)
Impact
Lithium Market Opportunity

No Energy Transition Without Lithium
The energy transition runs on critical minerals. Lithium leads them all.
Lithium has moved from a specialty metal to the single most critical input for global decarbonization. Four pillars explain why:
1. Irreplaceable In Electrification:
- Lithium-ion delivers the highest energy density of any proven, scalable battery chemistry.
- EVs and BESS already absorb ~61% of new lithium demand, and that share is projected to rise to 81% by 2030.
- The IEA ranks lithium as the fastest-growing critical mineral for net-zero pathways; no viable substitute exists at scale.
2. Supply Risk Is Structural:
- The top three countries control 77% of mining; ~70% of refining sits in one (China).
- Such concentration is the antithesis of energy security and has triggered unprecedented policy action in the EU, US, Canada, and other countries.
3. A Widening Investment Gap:
- Meeting forecast demand needs USD 500-600 billion in new mine CapEx by 2040, yet 2024 real investment grew just 2%.
- Exploration spending plateaued at USD 6.7 billion in 2024; lithium was the only area still growing (30%), underscoring the scarcity of bankable projects.
4. Supply Risk Is Structural:
- Supply bottlenecks threaten to delay EV roll-outs, inflate clean-power costs, and undermine industrial-policy goals.
- Diversified, low-impact projects such as Direct Lithium Extraction (DLE) and recovery from alternative brines have become priority targets for both governments and OEMs.
Energy Security Now Equals Mineral Security
The IEA’s “golden rule” of diversification has flipped from fuels to minerals. Oil and gas once dictated geopolitics; tomorrow, it is access to battery-grade lithium.
Unfortunately, the six principal energy-transition minerals (copper, lithium, nickel, cobalt, graphite, and rare earths) are becoming increasingly concentrated, particularly during the refining process. To counter that risk, over 37 countries (including the EU, US, and Canada) have all designated lithium as a strategic resource, unlocking over USD 10 billion in grants, tax credits, and concessional loans for domestic extraction and refining. Yet levelized battery-cell costs remain 40-50% higher in Europe and the US than in China, magnifying the urgency to localize resilient, low-cost supply chains.
In an era of heightened geopolitical tension, critical minerals have become the frontline of economic security.
Investor Perspective - The Asymmetry in Lithium
- Upside: Demand is codified in law, with ICE bans, ZEV quotas, and storage mandates, and is not swayed by sentiment.
- Protection: Supply diversification is explicitly subsidized; fast, low-carbon, domestic projects qualify for grants, tax credits, and green premium pricing.
Lithium’s unique chemistry makes it the non-negotiable enabler of electrification. Technologies that can deliver faster, cleaner, regionally sourced lithium at lower cost are positioned to earn outsized, policy-protected margins. This context frames the detailed supply-demand analysis, price dynamics, and policy tailwinds in the pages that follow.

World (Countries) |
United States |
Canada |
EU |
|
|---|---|---|---|---|
| Critical Minerals | United States, Canada, European Union, United Kingdom, Australia, Japan, South Korea, India, Chile, Bolivia, Mexico (Several other countries have taken steps recognizing lithium’s importance, though not always via formal designations in law). | Aluminum, Antimony, Barite, Beryllium, Bismuth, Cerium, Cesium, Chromium, Cobalt, Copper, Dysprosium, Erbium, Europium, Fluorspar, Gadolinium, Gallium, Germanium, Graphite, Hafnium, Holmium, Indium, Iridium, Lanthanum, Lead, Lithium, Lutetium, Magnesium, Manganese, Neodymium, Nickel, Niobium, Palladium, Platinum, Potash, Praseodymium, Rhenium, Rhodium, Rubidium, Ruthenium, Samarium, Scandium, Silicon, Silver, Tantalum, Terbium, Thulium, Tin, Titanium, Tungsten, Vanadium, Ytterbium, Yttrium, Zinc, Zirconium. | Aluminum, Antimony, Bismuth, Cesium, Chromium, Cobalt, Copper, Fluorspar, Gallium, Germanium, Graphite, Helium, High-purity iron ore, Indium, Lithium, Magnesium, Manganese, Molybdenum, Nickel, Niobium, Phosphorus, Platinum group metals, Potash, Rare earth elements, Scandium, Silicon metal, Tantalum, Tellurium, Tin, Titanium, Tungsten, Uranium, Vanadium, Zinc. | Coking Coal, Phosphorus, Antimony, Feldspar, Scandium, Arsenic, Fluorspar, Magnesium, Baryte, Strontium, Beryllium, Tantalum, Hafnium, Niobium, Helium, Phosphate Rock, Vanadium. |
| Strategic Minerals | Aluminium/Bauxite/alumina, Lithium, Light rare earth elements, Silicon metal, Gallium, Manganese, Germanium, Natural Graphite, Bismuth, Titanium metal, Boron, Platinum group metals, Tungsten, Cobalt, Heavy rare earth elements, Copper, Nickel. |
World (Countries)
United States
Canada
EU
Lithium Supply Chains Are Failing the Energy Transition
Mining and refining still run on 20th-century playbooks while battery demand is growing at 21st-century speed. Four facts make that clear:
Too Concentrated to Be Resilient
- 77% of raw lithium still comes from just three countries: Australia 35.2%, Chile 19.3%, China 22.3%.
- Refining is even more concentrated: ~70% of lithium chemicals are refined in China; add Argentina and Chile, and the top-three reach 95%, leaving North America and Europe with barely 2-3% of global capacity.
- For 19 of the 20 key transition minerals, China is also the largest refiner, averaging a 70% share. Concentration in lithium refining has increased since 2020 and is expected to remain above 80% through 2035 - mining activity exhibits a similar trend. A single weather, labor, or geopolitical shock now moves global battery and mineral security.
Traditional Supply Is Too Slow to Catch Up
- 66% of today’s lithium comes from hard-rock mines that need 10-17 years from discovery to first ton; evaporation-pond brines take 13-15 years to ramp. Traditional lithium mining methods account for 89% of the global supply.
- Demand jumped ~30% in 2024, triple the 2010s average, yet mine-sector CapEx rose just 2%. Even if every announced project is on time, the industry still faces a mid-decade shortfall. You cannot run the energy transition on decade-long build cycles.
Missed Opportunity in Secondary Brines
- Traditional DLE supplied only ~11% of global output in 2024.
- Oilfield wastewater and geothermal brines are forecast to add just ~110 kt LCE by 2035 - under 3% of projected demand - because few ventures align technology, feedstock rights, and capital in one package. The gap is not technology-theoretical; it is executional.
Corporate Power Is Consolidating
- Five upstream lithium producers (SQM, Albemarle, Tianqi, Pilbara Minerals, and Rio Tinto) already control nearly 70% of output, and all but Rio Tinto rely on the same slow, water-intensive mining methods. One hiccup at any flagship asset reverberates across the entire battery value chain.
Investor Takeaway
Traditional supply is too slow, too centralized, and too inflexible to keep pace with global demand. Diversified, local, sustainable sources are the only credible bridge between legislated demand and physical availability.
Lithium Harvest targets exactly that white space: turning underutilized oilfield and geothermal brines into battery-grade lithium in 12-18 months, rather than decades.


A Looming Lithium Deficit
A massive supply gap is looming, and projects cannot keep pace.
Lithium is the “lifeblood” of electric-mobility and stationary-storage batteries, making it a focal point of both opportunity and concern on the road to 2030 and 2040. EV mandates, grid storage targets, and carbon-neutral pledges make lithium demand a policy certainty, not just a market option. What is uncertain is how quickly supply can be brought online.
The transition to electric mobility and renewable energy is driving exponential growth in lithium demand through 2030 and beyond. Yet today’s supply chain is already stretched thin - marked by near-100% utilization of current operating capacity and price volatility. Without a massive and sustained build-out of new supply infrastructure, the world faces a growing shortfall. Analysts warn that by 2029, deficits could reach thousands of tons of lithium carbonate equivalent (LCE). By 2040, the gap could widen to several million tons per year - jeopardizing the acceleration of the energy transition.
While lithium resources are geologically abundant, the bottleneck lies in bringing economically and environmentally viable projects online. Much of the required future supply must come from ventures that have not yet been built, or even discovered, including secondary sources such as oilfield and geothermal brines. Complicating matters, the recent drop in lithium prices risks dampening near-term investment in new capacity, setting the stage for a more resounding supply crunch later this decade. The mining industry is cyclical, and if investment lags in the next few years, the long-term shortfall could be severe just as EV demand reaches its peak growth.
Bottom line: The long-term outlook depends on fast-tracking projects not yet on the map. The clock is ticking.
Demand Is Exploding - And It Is Structural
- 2024: Demand jumped ~30% year-on-year - triple the growth pace of the 2010s.
- 2030: Analyst consensus forecasts call for 2-3x 2024 demand, implying a CAGR of 15.7%.
- 2035: Most analysts converge on 3.5-4.2x 2024 levels,
- By 2040, lithium demand exceeds today’s level by 4.7-5.5x in high-adoption scenarios - a CAGR of 10% from 2024.
- EV & BESS are already 61% of consumption and will exceed 90% of lithium demand by 2040; that share is locked in by policy and automaker commitments.
Supply: Slow, Capital-Starved, at Risk
- 2024 balance: Roughly 1.15 Mt LCE of supply met 1.15 Mt of demand, but this balance is fragile.
- Pipeline reality: Even if every announced project is built, supply covers only ~85% of demand in 2029 (55-445 kt LCE/yr shortfall), 70-83% in 2035, and 65-75% by 2040.
- Project attrition: 11-13 lithium projects - mostly high-CapEx, mid-to-high OpEx hard-rock mines totaling 150-282 kt LCE per year - have been cancelled or postponed due to market conditions. Weaker prices, billion-dollar upfront costs, mid-tier operating margins, and tough permitting have made them unbankable. Strip those tons from the pipeline, and today’s “surplus” turns into a deficit several years earlier than consensus models suggest.
- Execution drag: Hard-rock mining averages 10-17 years from discovery to first ton; brine ponds, 13-15 years. Meanwhile, mining CapEx rose only 2% in 2024, and exploration spending has stalled at approximately USD 6.7 billion.
When the Gap Opens - And How Wide
- Base-case deficit: Begins 2029 (-55 kt LCE), widens to -700 kt by 2035 and -1300 kt by 2040.
- High-demand scenario: Shortfall is 450 kt by 2029, 1450 kt by 2035, and 2200 kt by 2040.
Why the Shortfall Arrives Sooner Than Models Suggest
- Long lead times: Two-thirds of supply still comes from hard-rock mines that need 10-17 years to permit and build. In 2022, mass public protests led Serbia’s government to revoke Rio Tinto’s Jadar exploration license. Although the Constitutional Court overturned the decision in 2024, the project still suffered a two-year delay.
- Capital hesitation: Mine CapEx rose just 2% in 2024, even as demand soared; exploration spending has plateaued. Low prices in 2024-25 mute investment precisely when new projects should break ground for late-decade delivery.
- Execution risk: Oilfield and geothermal brines could be rapid, low-carbon sources, yet they are expected to meet <3% of 2035 demand because most DLE ventures lack the trio of proven tech, feedstock rights, and project finance.
Abundant Geology ≠ Guaranteed Supply
Global reserves (~120-140 Mt LCE) are theoretically enough for billions of EVs, but fewer than 1 in 10 tons are permitted or under development. ESG constraints, water scarcity, low grades, financing, and community opposition mean geology is the easy part - execution is not.

| Year | Supply | Base Case Demand | Base Case Supply Cap | High Case Demand | High Case Supply Cap | Supply Coverage (%) | Lithium at Risk |
|---|---|---|---|---|---|---|---|
| 2024 | 1,145,000 | 1,145,000 | 0 | 1,145,000 | 0 | 100% | 48,363 |
| 2025 | 1,388,889 | 1,388,889 | 0 | 1,555,556 | -166,667 | 89%-100% | 150,363 |
| 2026 | 1,666,667 | 1,666,667 | 0 | 1,888,889 | -222,222 | 88%-100% | 200,363 |
| 2027 | 1,888,889 | 1,888,889 | 0 | 2,333,333 | -444,444 | 81%-100% | 200,363 |
| 2028 | 2,222,222 | 2,222,222 | 0 | 2,555,556 | -333,334 | 87%-100% | 225,363 |
| 2029 | 2,444,444 | 2,500,000 | -55,556 | 2,888,889 | -444,445 | 85%-98% | 225,363 |
| 2030 | 2,666,667 | 2,722,222 | -55,555 | 3,333,333 | -666,666 | 80%-98% | 225,363 |
| 2031 | 2,888,889 | 3,000,000 | -111,111 | 3,666,667 | -777,778 | 79%-96% | 225,363 |
| 2032 | 3,055,556 | 3,222,222 | -166,666 | 3,944,444 | -888,888 | 77%-95% | 225,363 |
| 2033 | 3,111,111 | 3,500,000 | -388,889 | 4,222,222 | -1,111,111 | 74%-89% | 225,363 |
| 2034 | 3,222,222 | 3,777,778 | -555,556 | 4,555,556 | -1,333,334 | 71%-85% | 225,363 |
| 2035 | 3,333,333 | 4,000,000 | -666,667 | 4,777,778 | -1,444,445 | 70%-83% | 282,363 |
| 2036 | 3,444,444 | 4,277,778 | -833,334 | 5,222,222 | -1,777,778 | 66%-81% | 282,363 |
| 2037 | 3,555,556 | 4,555,556 | -1,000,000 | 5,611,111 | -2,055,555 | 63%-78% | 282,363 |
| 2038 | 3,666,667 | 4,777,778 | -1,111,111 | 5,833,333 | -2,166,666 | 63%-77% | 282,363 |
| 2039 | 3,777,778 | 5,000,000 | -1,222,222 | 6,000,000 | -2,222,222 | 63%-76% | 282,363 |
| 2040 | 4,055,556 | 5,333,333 | -1,277,777 | 6,277,778 | -2,222,222 | 65%-76% | 282,363 |
Lithium Price Dynamics
Concentration risk and pricing power. China’s dominance in the lithium chemicals and battery chain has, at times, suppressed prices through scale tactics, stockpiling, price competition, and policy moves. Reducing that concentration is essential; building local supply can improve stability, resilience, and energy security.
Global lithium prices have been anything but stable. After skyrocketing in 2021-2022 due to EV demand and tight supply, prices collapsed by 89% from their peak by 2022. But this cycle is not unique. It reflects the underlying structural mismatch in the lithium market: multi-year supply build cycles versus short-term demand shifts and policy waves. The market’s recent correction may feel like oversupply - but the seeds of the next shortage are already planted.
What’s Driving the Volatility?
- Rapid supply growth (2023-2024): A wave of production in Australia, Chile, and China briefly outpaced demand.
- China’s stockpiling & price wars: Local producers curtailed imports, dumping stock to gain market share.
- Downstream destocking: OEMs delayed new purchases to run down inventory.
- Policy and trade disruptions: Export controls, permitting delays, and macro shocks created market noise and project delays.
Strategic Takeaways for Investors
The 2023-25 downturn wiped out ~282 kt LCE of future supply - a structural reset. Low-cost, fast-build projects that meet local supply and ESG demands will win. Today’s low prices hide a fragile pipeline; backing fast, regional producers now capture the next potential squeeze while staying profitable through the dips.
Market Phases: A High-Conviction Timeline to 2035
Spot Price Range |
Drivers |
Strategic Signals |
|
|---|---|---|---|
| 2021-2022 | Super Spike | Spot lithium carbonate rocketed from ≈$8,323/t (Jan 21) to >$86,406/t (Nov 22) | Explosive EV demand, constrained supply, empty inventories | Windfall margins triggered 100+ mine & refinery FIDs and encouraged even marginal projects |
| 2023-2025 | Reset | <$9,193/t (March 25) → ~$11,617/t rebound (Q2-25) (-89% in 27 mo) | A wave of Australian, Chilean, and Chinese supply hit just as China’s battery chain de-stocked and EV growth paused, plus macro and policy shocks | Prices fell below incentive levels for 40% of pre-FID projects. The shake-out has already delayed or cancelled 11-13 projects, removing 150-280 kt LCE/y from the pipeline |
| 2025-2029 | Fragile Floor | $11,000-$16,000/t (forecast range) | 11-13 project cancellations; CapEx slowdown; export controls; rising offtake demand | Export curbs, stalled FIDs, and bidding wars point to a 2027-29 deficit, with only low-cost and fast-ramp projects able to fill the gap |
| 2030s | Structural Tightness | Consensus price >$20,000/t by 2034 | Demand is set to grow 3.5-4.2×, while projects cover only ~70% - prompting premiums for low-carbon, local supply | Premiums for ESG-compliant, regionally secure supply |
Spot Price Range
Drivers
Strategic Signals
Forecasted Lithium Carbonate Price
Our financial model is based on progressive pricing aligned with analyst consensus
| Benchmark Minerals | Wood Mackenzie | Goldman Sachs | S&P Global | Analyst Consensus Price | |
|---|---|---|---|---|---|
| 2027 | $17,000 | $13,500 | $15,646 | $10,566 | $14,178.00 |
| 2028 | $25,000 | $13,000 | $17,077 | $11,000 | $16,519.25 |
| 2029 | $23,000 | $13,000 | $16,000 | $12,000 | $16,000.00 |
| 2030 | $22,000 | $12,700 | $16,000 | $13,000 | $15,925.00 |
| 2031 | $21,000 | $12,500 | $16,000 | $14,750 | $16,062.50 |
| 2032 | $21,000 | $17,000 | $16,000 | $15,000 | $17,250.00 |
| 2033 | $21,000 | $25,000 | $16,000 | $16,500 | $19,625.00 |
| 2034 | $21,000 | $27,000 | $16,000 | $17,500 | $20,375.00 |
| 2035 | $21,000 | $27,400 | $16,000 | $20,000 | $21,100.00 |
Lithium Demand Drivers
EV Growth is Transformational
Electric vehicles (EVs) are the single largest driver of lithium demand:
- Sales momentum: 17.1 million EVs sold in 2024, on track for 40 million by 2030 (+233%). EV sales are set to exceed 20 million in 2025, with Q1-2025 sales up 25% YoY.
- Market penetration: EV share is set to increase from 22% (2024) to 42% (2030).
- Fleet build-out: Global EV fleet is set to grow from 58 million (2024) to 235 million (2030) and >500 million by 2035 (~850% expansion).
- Battery pull-through: Pack demand is set to scale from 840 GWh in 2024 to ~2,600 GWh by 2030 (3x).
- Lithium impact: EV batteries alone are set to lift lithium use from ~0.7 Mt LCE (2023) to ~3 Mt by 2030 - a 338% surge.
- Economics, not subsidies: Consumer spend hit USD 560 billion in 2024 while subsidies fell to <7% of outlays (20% in 2017). Price parity and model choice (with more than 1,000 expected by 2026) now drive adoption.
Energy Storage: The Fast Follower
- Capacity surge: BESS installations are set to increase from 205 GWh (2024) to 520-700 GWh (2030), a 2.5-3.5x increase.
- Cost tailwind: Levelized cost of storage is predicted to decrease ~60% (US$0.05 → <0.02/kWh), unlocking utility and residential uptake.
- Share of demand: By 2030, storage alone could absorb ~10% of global lithium.
- System criticality: BESS enables integration of variable renewables and strengthens grid reliability.
Electrification Everywhere
Heavy fleets, two-wheelers, heat pumps, portable electronics, short-haul flights, robots, coastal marine vessels, and industrial vehicles all add incremental pull. With EVs and BESS already at 61% of lithium use - and set to exceed 90% by 2040 - the chemistry’s dominance is locked in.
Strategic Takeaway
This is structural, not cyclical. Lithium demand is being driven by infrastructure, electrification, and economics - not just sentiment. EVs and BESS already account for 61% of lithium use and are projected to exceed 90% by 2040. Every credible net-zero pathway requires multiple-fold growth in these sectors, making lithium the throughput mineral of the energy transition.


The Problem
Why Traditional Lithium Mining Falls Short
A slow, capital-heavy, fragile path that still supplies 89% of lithium today.
Built for commodity cycles, not exponential battery demand. Hard rock mines and solar evaporation brines dominate with 89% of supply, but they are too slow, too capital-heavy, too water-intensive, and too concentrated to deliver the tonnes policymakers and OEMs have already mandated. These conventional methods face structural bottlenecks - economic, environmental, technological, and regulatory - that constrain rapid and sustainable scale-up.
-
Economic Bottlenecks
- High cost and capital intensity. Greenfield projects typically run US$0.5-1.5 billion investment before revenue and have a slow payback; when prices fall, projects often pause or slip - starving supply just when it is needed the most. 11-13 projects are already delayed/canceled under current market conditions - primarily hard rock mining operations.
- Concentrated, price-taker position. A few countries dominate the mining industry, and an even smaller group dominates the refining industry. As a result, miners sell unrefined products to third-party refiners, forfeiting downstream margins. The top three countries control ~77% of mining and 95% of refining; China holds around 70% of global refining, while Europe accounts for ~0% and North America for around 2%. Disruptions, trade frictions, or resource nationalism can pose significant economic risks to global supply chains.
- Geographic constraints dampen scale. Brine evaporation is viable only in arid, high insolation deserts; hard rock is feasible only at sufficiently high grade and with access to power, water, and reagents. These constraints limit the expansion of new supply regions and concentrate geopolitical risk.
- The pipeline is short of a durable balance. Even after a near-term surplus, demand growth requires many new mines and refineries. The current pipeline covers only ~84% of projected 2029 needs, and recent cancellations or slowdowns point to tighter 2027-2029 balances.
Investor Takeaway: Traditional routes have a high fixed cost base, slow capital turnover, and heavy exposure to volatile downstream markets and geopolitics - not ideal for rapid, resilient growth.
-
Environmental Bottlenecks
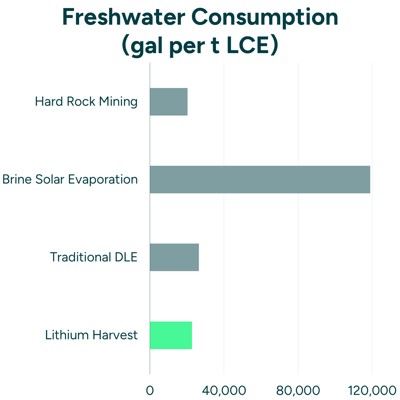
- Extreme water consumption. Evaporation ponds consume huge volumes of brine and significant amounts of freshwater for reagents/utilities; recovery is modest, so most of the lithium and water are not converted into products. Competing users (communities, agriculture, ecosystems) amplify conflict risk in arid basins. 50% of the capacity already resides in water-stressed basins. Solar pond operations use up to 118,877 gallons of freshwater per metric ton of LCE, which is 423% more than Lithium Harvest. Hard rock flowsheets still require substantial process water even with recycling and rainwater capture.
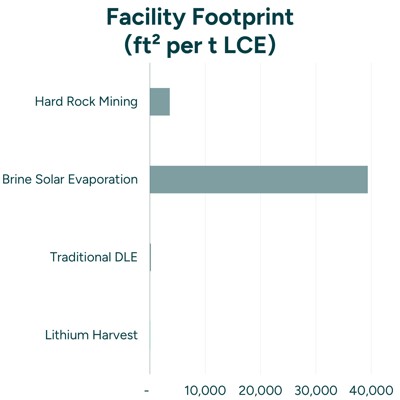
- Land disturbance and waste. Evaporation ponds occupy large footprints and leave salt-rich residues; hard rock generates waste rock and tailings with leakage/failure liabilities. Typical footprint per mt LCE: Solar evaporation 39,352 ft², hard rock 3,605 ft² - leaving visible surface scars and long-lived stockpiles.
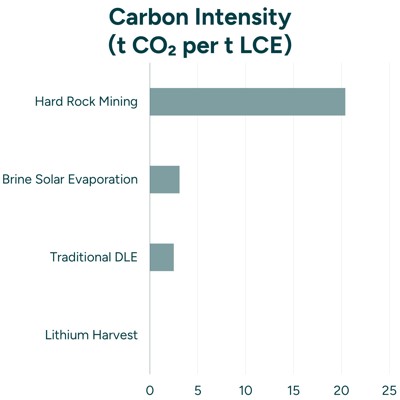
- High energy and carbon intensity. Spodumene routes are energy-intensive from mining through calcination and conversion. Emissions profiles are 3.1t CO₂/mt for evaporation and 20.4t CO₂/mt for hard rock.
- Pollution and community impact risk. Without best-in-class controls, both routes can affect groundwater, surface hydrology, and soils; permitting and monitoring requirements are tightening accordingly, extending timelines, and increasing costs.
Investor Takeaway: Water, land, emissions, and waste risks translate directly into permitting friction, ESG discounting, higher OpEx/CapEx, and reputational exposure. And, of course, why ruin our nature while trying to save it?
-
Technological Bottlenecks
- Low recovery and slow cycles. Solar evaporation typically recovers only 20-50% of lithium and takes 13-24 months, limiting responsiveness and delaying ramp-up. Traditional DLE recovers 80-95%; Lithium Harvest achieves up to 18.75% higher recovery rates,+375% higher than evaporation, and +137.5% higher than hard rock mining. Traditional mining does not maximize project value. Cycle times highlight the gap: traditional DLE takes 2 hours, evaporation takes 13-24 months (Lithium Harvest is 8,766 times faster), and hard rock takes 3-6 months (Lithium Harvest is 2,191 times faster).
- Inflexible operating envelope. Brine ponds require arid climates and stable weather; hard rock needs a suitable grade, power, and logistics. Costs rise sharply outside these conditions.
- Ramping complexity. New chemical plants (carbonate/hydroxide) are challenging to start and stabilize; many recent refineries have required multi-year debottlenecking to reach specifications and throughput.
Investor Takeaway: Traditional tech is inherently slow and location-bound, with recovery and throughput limits that cap saleable tonnes, delay cash flows, and erode margins.
-
Regulatory & Social Bottlenecks
- Long project timelines. Discovery to first production commonly exceeds a decade; rigorous EIAs, land use and water rights permits, and legal challenges add years. Indicative ranges: DLE from brine 5-7 years, evaporation 13-15 years, hard rock 10-17 years. These timelines cannot meet future demand windows, creating deficits.
- Social license risk is rising. Indigenous and local communities demand consultation, benefit sharing, and strict water governance; protests and litigation can halt access or delay schedules.
- Geopolitical concentration (N1 risk). Refining is heavily concentrated; removing the largest supplier leaves the world with a shortage. Excluding China would remove ~70% of the refined product.
- Tightening ESG and offtake criteria. Automakers and cell makers require traceability, water/CO₂ performance, and local content - thresholds that many legacy assets struggle to meet without costly retrofits.
Investor Takeaway: Permitting drag and social opposition are now “first-order” determinants of schedule and cost. Supply security concerns push buyers to diversify away from single-point dependencies.
-
Why This Matters
Traditional lithium mining cannot rapidly, cleanly, or flexibly scale where demand is growing. Its bottlenecks - cost, water/land use, carbon intensity, slow cycles, concentration risk, and permitting friction - create persistent supply insecurity and price volatility. Any solution that:
- shortens payback and reduces CapEx per incremental tonne,
- materially lowers water use/land footprint and embedded CO₂,
- boosts recovery and compresses cycle times,
- and diversifies geography and midstream processing
will command premium offtakes, lower ESG risk, and a superior risk-adjusted return profile.
Traditional Lithium Production
Comparison of traditional lithium extraction technologies.

Traditional DLE |

Solar Evaporation Brine Extraction |

Hard Rock Mining |
|
|---|---|---|---|
| Lithium feedstock | Continental brine | Continental brine | Rock / spodumene |
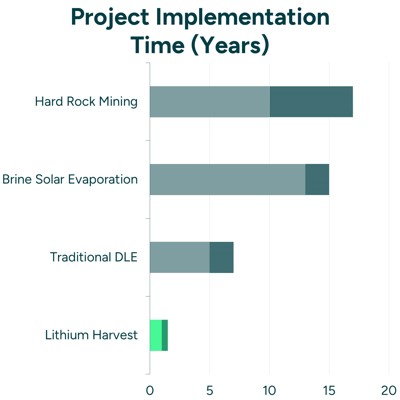
| Project implementation time | 5-7 years | 13-15 years | 10-17 years |
| Lithium carbonate production time | 2 hours | 13-24 months | 3-6 months |
| Lithium yield | 80-95% | 20-50% | 40-70% |
| Average footprint per mt of LCE | 172 ft² | 39,352 ft² | 3,605 ft² |
| Environmental impact | Minimal | Soil and water contamination | Soil and water contamination |
| Freshwater consumption per mt of LCE | 26,417 gallons | 118,877 gallons | 20,341 gallons |
| CO₂ footprint per mt of LCE | 2.5 tonne | 3.1 tonne | 20.4 tonne |
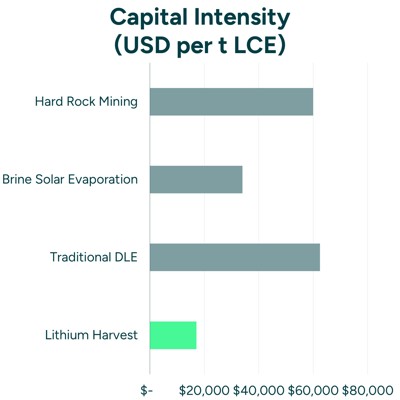
| Average invested capital per mt of LCE | $62,500 | $34,000 | $60,000 |
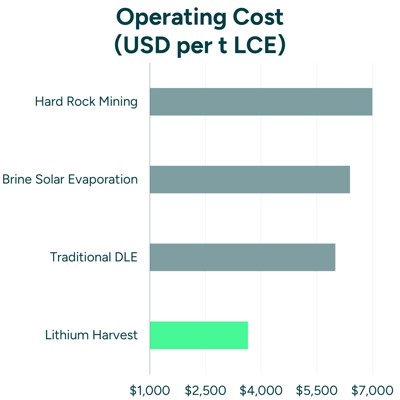
| Average cost per mt of LCE | $6,000 | $6,400 | $7,000 |
Traditional DLE
Solar Evaporation Brine Extraction
Hard Rock Mining
Traditional DLE
Please have a look at traditional direct lithium extraction from brine.
Direct Lithium Extraction (DLE) represents a transformative approach to lithium extraction, offering numerous advantages over traditional methods. DLE technologies can be classified into adsorption, ion exchange, and solvent extraction processes. These innovative techniques enable lithium extraction directly from complex brines with high concentrations of various ions.

Solar Evaporation Brine Extraction
Please have a look at traditional lithium extraction from solar evaporation brine.
Solar evaporative brine processing has been a dominant method for lithium extraction, particularly in South America's Salars. Solar evaporation is commonly employed in lithium extraction from brine and relies on solar evaporation to concentrate lithium and other salts. The brine is pumped into expansive evaporation ponds, occupying vast areas, where it undergoes a year-long process to achieve sufficient lithium concentration. However, this method presents several concerns:
- It consumes an immense amount of water, further straining regions already facing water scarcity.
- The recovery rates are relatively low, typically capturing only about 50% of the original lithium content of the brine.
- The disposal of waste salts and the use of chemical reagents pose environmental challenges.

Hard Rock Mining
Please have a look at traditional lithium extraction from hard rock mining.
Hard rock mining, focusing on extracting lithium from spodumene-bearing pegmatites (or clusters of rocks and crystals), involves energy-intensive processes and chemical usage. After mining the ore, it undergoes crushing, concentration, and chemical treatments, including roasting and leaching, to obtain a lithium concentrate. This method poses several environmental concerns, such as chemical waste disposal and groundwater contamination, rivers, and soil contamination. The transportation of crushed rock to China for processing adds to the carbon footprint and the need for more transparency regarding waste handling practices.

Can We Do It Differently?

Rethinking Critical Mineral Supply
From distant megaprojects to local & modular lithium production.
The world’s plan for critical minerals was built around remote, billion-dollar projects: long lead times, heavy infrastructure, and shipping concentrates halfway around the planet to be refined. That model is slow, fragile, and costly - the opposite of what the electrification needs.
We Do It Differently
Instead of chasing lithium in far-flung deserts, we extract lithium from wastewater - oilfield produced water and geothermal brines - right where the infrastructure already exists. We extract and refine on-site in decentralized, modular facilities co-located with midstream operators, then deliver battery-grade chemicals to nearby cathode and cell plants. The result is a local, reliable supply built for speed, cost discipline, and ESG.
The New Model
- Speed to revenue: Site selection and commissioning measured in months, not years. Deliver the first tonnes quickly, then scale by replication - not by waiting for the next megaproject.
- Capital efficiency: Utilizing existing feedstock and infrastructure, and a design based on proven technology and off-the-shelf equipment.
- Cost visibility: Fewer handoffs and shorter logistics mean tighter OpEx control and lower volatility.
- Cost-disciplined over capital-heavy: Short build cycles, use of existing pads/roads/power, and an integrated flow sheet target low all-in cost and faster payback.
- Supply security: Regionalized production near brine sources and end-markets hedges against export controls, shipping shocks, and refinery bottlenecks.
- Waste-to-value: Turn a liability stream into a strategic feedstock. No large evaporation ponds or pits. Compact footprint with closed-loop lithium extraction.
Why rely on distant, high-cost sources when the solution is right here?
We are building a modern critical-minerals platform that turns wastewater into local, sustainable, and cost-effective battery-grade lithium - the fastest route from resource to market.

We Turn Wastewater Into High-Value Minerals

Our Solution
We turn wastewater into high-value minerals.
Lithium Harvest produces lithium chemicals for the EV and broader battery markets by extracting lithium from secondary/unconventional brines - oilfield produced water and geothermal brines - exactly where these streams already flow and where infrastructure already exists. Instead of waiting years for distant mines and ponds, we deploy modular Direct Lithium Extraction (DLE) integrated with proprietary water treatment to deliver local, battery-grade lithium carbonate fast - with extraction and refining on-site by design.
Lithium Harvest employs a “Design-Build-Own-Operate” (DBOO) model for its lithium extraction facilities. This means we handle the entire project lifecycle - designing and constructing the extraction system - co-located at partners’ sites - midstream hubs, oilfields, and geothermal plants. Partners provide the brine; we run the facility and share value through revenue-share or royalties. The result is hassle-free monetization of a liability stream, minimal disruption, and scalability through replication - not by waiting for the next megaproject.
Why Us
- Patented platform: IP-protected adsorption-based DLE integrated with an advanced water treatment solution; on-site extraction and refining tailored to each brine.
- Execution pedigree: 20+ years of industrial water, separation, and control system know-how - the difference between a promising flowsheet and a plant that meets spec.
- Commercial building blocks: Core unit operations are field-proven in adjacent industries; scale-up is an engineering and execution task, not basic science.
- Built for low-grade brines: Designed to be profitable at low lithium concentrations, reinforced by technology partnerships and validation from commercial DLE analogs.
Bottom line: Lithium Harvest converts a liability stream into local, low-cost, zero-carbon lithium at industrial speed - bridging some of the gap between mandated demand and available supply, and compounding value one replicated module at a time.

Why We Win
- Speed: Online in 12-18 months (up to 17× faster than greenfield mining).
- Cost-Efficiency: Up to 73% lower CapEx and 48% lower OpEx vs. conventional production.
- Yield & throughput: Hours-scale production cycles (up to 8,766× faster than evaporation) with up to 375% higher lithium yield - a direct boost to IRR and payback.
- Sustainability: Carbon-neutral process design (vs. up to 20.4t CO₂/t LCE for hard rock), 81% lower freshwater use, up to 99% smaller land footprint.
- Co-benefits: Treated water can be reused or safely disposed - turning a cost center into new income for oil producers and creating dual revenue (power + minerals) for geothermal partners.
- Flexibility: Ability to produce from different feedstocks (oilfield water, geothermal brine, etc.) due to our adaptable process design. This broadens the reachable resource base beyond what many competitors can process.

Lithium Harvest Solution |

Peer Benchmark |
|
|---|---|---|
| Lithium feedstock | Produced water/geothermal brine | Continental brine/spodumene |
| Project implementation time | 12-18 months | 5-15 years | up to 17.0× faster |
| Lithium carbonate production time | 2 hours | 2 hours - 6 months | up to 8,766× faster |
| Lithium yield | >95% | 20-95% | up to 375% higher |
| Average footprint per mt of LCE | 61 ft² | 172 ft² - 39,352 ft² | up to 99% smaller |
| Environmental impact | Minimal | Soil and water contamination |
| Freshwater consumption per mt of LCE | 22,729 gallons | 26,417 - 118,877 gallons | up to 81% lower |
| CO₂ footprint per mt of LCE | Neutral | 2.5 - 20.4 tonne | 100% lower |
| Average invested capital per mt of LCE | $17,100 | $34,000 - $62,500 | up to 73% lower |
| Average cost per mt of LCE | $3,647 | $6,000 - $7,000 | up to 48% lower |
Lithium Harvest Solution
Peer Benchmark
We believe that our patented technology is the fastest to market and lowest cost of any lithium mining technology in the market.
Direct Lithium Extraction - But Different
Our patented solution is Direct Lithium Extraction (DLE) based on adsorption
technology. Using wastewater from oil & gas production and geothermal
operations as our feedstock, allows us to bring lithium operations online much quicker and at a lower cost than any other DLE technology in the market.
Lithium Harvest Solution |
Traditional DLE |

Lithium Harvest Advantage |
|
|---|---|---|---|
| Project implementation time | 12-18 months | 5-7 years | No drilling permits needed |
| Lithium feedstock | Produced water/geothermal brine | Continental brine | No asset acquisition |
| System design | Modular and mobile | Mobile / stationary | Unique modular design |
| Freshwater consumption per mt of LCE | 22,729 gallons | 26,417 gallons | Water recycling/reuse |
| CO₂ footprint per mt of LCE | Neutral | 2.5 tonne | Offsets CO₂ footprint from wastewater |
| Average invested capital per mt of LCE | $17,100 | $62,500 | No land acquisition, exploration, and drilling |
| Average cost per mt of LCE | $3,647 | $6,000 | Low energy technology |
Lithium Harvest Solution
Traditional DLE
Lithium Harvest Advantage
We Outpace Peers
Lithium Harvest Solution |
Traditional DLE |
Solar Evaporation Brine Extraction |
Hard Rock Mining |
|
|---|---|---|---|---|
| Lithium feedstock | Produced water/geothermal brine | Continental brine | Continental brine | Rock / spodumene |
| Project implementation time | 12-18 months | 5-7 years | 13-15 years | 10-17 years |
| Lithium carbonate production time | 2 hours | 2 hours | 13-24 months | 3-6 months |
| Lithium yield | >95% | 80-95% | 20-50% | 40-70% |
| Average footprint per mt of LCE | 61 ft² | 172 ft² | 39,352 ft² | 3,605 ft² |
| Environmental impact | Minimal | Minimal | Soil and water contamination | Soil and water contamination |
| Freshwater consumption per mt of LCE | 22,729 gallons | 26,417 gallons | 118,877 gallons | 20,341 gallons |
| CO₂ footprint per mt of LCE | Neutral | 2.5 tonne | 3.1 tonne | 20.4 tonne |
| Average invested capital per mt of LCE | $17,100 | $62,500 | $34,000 | $60,000 |
| Average cost per mt of LCE | $3,647 | $6,000 | $6,400 | $7,000 |
Lithium Harvest Solution
Traditional DLE
Solar Evaporation Brine Extraction
Hard Rock Mining
Difference Table (In Our Favor)
Vs Traditional DLE |
Vs Solar Evaporation |
Vs Hard Rock Mining |
|
|---|---|---|---|
| Project implementation time | 86% shorter | 93% shorter | 94% shorter |
| Lithium carbonate production time | Parity | 99% shorter | 99% shorter |
| Lithium yield | 19% higher | 375% higher | 138% higher |
| Average footprint per mt of LCE | 65% smaller | 99% smaller | 98% smaller |
| Freshwater consumption per mt of LCE | 14% lower | 81% lower | 12% higher |
| CO₂ footprint per mt of LCE | 100% lower (net-zero vs 2.5 t) | 100% lower (net-zero vs 3.2 t) | 100% lower (net-zero vs 20.4 t) |
| Average invested capital per mt of LCE | 73% lower | 50% lower | 72% lower |
| Average cost per mt of LCE | 39% lower | 43% lower | 48% lower |
Vs Traditional DLE
Vs Solar Evaporation
Vs Hard Rock Mining
Technology Benchmark - Environmental Impact
Zero-Carbon Footprint
We remove the big emitters - no blasting, no trucking, no acid calcination. By co-locating extraction and refining at the source, powering low-pressure equipment with clean energy (incl. geothermal where available), and crediting the avoided emissions from oilfield wastewater disposal, Lithium Harvest essentially eliminates scope 1 and scope 2 CO₂ emissions.
Investor Takeaway: Lower-carbon premium: As lifecycle standards tighten worldwide, OEMs pay more for lithium that reduces pack-level emissions; our product helps them meet their Scope 3 targets.
Compact by Design; No Ponds, No Pits
Evaporation ponds sprawl across salt flats - tens of thousands of square feet per ton of LCE produced - while hard-rock pits, waste dumps, and tailings dams scar larger areas than the orebody itself. Lithium Harvest’s operations are strategically located alongside produced water treatment centers and geothermal operations, which are 99% smaller than ponds and 98% smaller than open-pit mines. No new roads, pipelines, or wildlife relocation. Smaller pads = easier siting, faster permits, lower civil costs, and far less ecological and community disturbance.
Investor Takeaway: A minimal footprint shortens environmental reviews, lowers reclamation bonding, and reduces residual-liability discounts in valuation models.
Minimal Freshwater Consumption
Traditional brines evaporate vast volumes in arid basins; hard-rock circuits require chemically intensive process water. We chose an adsorption-based DLE that uses water as desorption - not chemicals - as the working fluid; 96% of that water is within the DLE circuit, and 90% is recycled plant-wide: no waste-products.
Why a bit more water than hard rock?
Using water rather than chemicals lowers costs; we materially undercut evaporation’s freshwater intensity and remain competitive with other DLE routes, while avoiding the hard-rock chemistry burden.
Investor Takeaway: License to operate: Water stress is a gating criterion for offtakers and sustainable bond buyers. Our closed-loop design clears that hurdle.
Technology Benchmark - Business Case
Optimized Capital Expenditure
Ponds require massive earthworks and working capital tied up for years before first revenue; hard rock mines require a substantial upfront investment in mine development, mineral concentrators, and conversion plants. We have streamlined the initial investment in lithium extraction infrastructure. By eliminating the need for land acquisition and drilling rights, we have significantly reduced CapEx. Modular design right-sizes equipment to brine flow, so dollars go to throughput, not dirt. Lower upfront capital and quicker installation result in a shorter payback period.
Investor Takeaway: Lower capital at risk and shorter build cycles translate into quicker payback and positive project economics at mid-cycle prices.
Cost Leadership in Lithium Production
Heavy mining, diesel haulage, 1,000°C kilns, and multi-step chemical conversion make hard rock the cost laggard; evaporation recovers only 20-50% of the contained lithium, wasting reagents and labor. We run fully automated, low-pressure unit operations, short logistics, high lithium recovery, and minimal reagents after pretreatment, all of which reduce run-rate costs. Fixed-price access to waste-stream feedstock removes a significant source of input volatility seen in mined-ore routes. Result: lower steady-state unit cost and resilience at the bottom of the price cycle. Our costs are up to 48% lower than traditional mining methods, positioning us as one of the leaders.
Investor Takeaway: Lower steady-state unit costs keep us cash-positive through price troughs, while higher-cost peers idle.
Accelerating Project Timelines
We have transformed the timeline for bringing new lithium operations online. Conventional projects typically take 10-17 years (for hard-rock) or 13-15 years (for evaporation) to reach nameplate capacity. We use existing produced-water/geothermal infrastructure - no new pits, ponds, or long pipelines - and commission on-site extraction and refining in 12-18 months.
Investor Takeaway: Speed secures early-market premiums and lets us compound cash into additional modules long before slower competitors break ground. FID to first tonne in just over a year.
CapEx Benchmark
CapEx per t LCE - Peer Benchmark
CapEx Intensity vs DLE Peers ($/tpa of LCE) Analysis
Positioning: Lithium Harvest (LH) reports $17,100/t CapEx intensity. Among our peer set of 22 disclosed DLE projects, observed CapEx/mt spans $14k-$76.6k, with a median $38.9k and mean $42.3k (unweighted). A capacity-weighted average is $37.7k/t (where both capacity and CapEx are disclosed). At $17.1k/t, Lithium Harvest sits in the very bottom of the distribution (5th percentile), i.e., among the lowest CapEx/t observed in the set.
Relative gaps (Lithium Harvest vs peers):
- vs median ($38.9k): -56%
- vs mean ($42.3k): -59.6%
- vs capacity-weighted avg ($37.7k): -54.6%
- vs p25 ($29.2k):-41.4%
- vs p75 ($57.2k): -70.1%
Nearest neighbors in the file:
- Zijin Mining Group $18,528/t (+$1.4k vs LH)
- Peer-set minimum $14,000/t (-$3.1k vs LH)
- CleanTech Lithium now sits further above at $22,500/t (+$5.4k vs LH)
Distribution & dispersion: Unweighted distribution (n=22) - min $14k, p25 $29.2k, median $38.9k, p75 $57.2k, max $76.6k, mean $42.3k. Range ~5.5× (max/min), IQR ~$28k - wide spread even within DLE.
Scale signal: Where capacity was disclosed (n=21), capacity vs CapEx/t shows a modest inverse correlation ~-0.27. Larger plants tend to have lower unit CapEx, but scope, site, and chemistry drive most of the variance.
Why this matters: At $17.1k/t, Lithium Harvest is in the lowest-cost decile with material headroom versus both unweighted and capacity-weighted peer averages. This positioning can absorb scope growth, inflation, or contingency and remain near Q1, preserving a clear capital-efficiency edge in this disclosed DLE set.
Investor Takeaway:
- Top-tier unit CapEx: Lithium Harvest’s $17.1k/t is ~56% below the peer median and ~55% below the capacity-weighted average in this benchmark.
- Resilience to scope drift: The $21.8k/t gap vs the median provides material headroom for scope additions while preserving a Q1 position, assuming like-for-like scope.
- Scale helps, but isn’t destiny: With corr ~-0.27, design choices and site specifics likely explain most dispersion - Lithium Harvest’s outcome reflects choices and conditions beyond scale.
Disclaimer: The file does not standardize the CapEx scope, estimate class, and base year. Not all lithium projects are included; conclusions apply to this dataset. Rankings may shift after scope and inflation normalization. Outcomes may differ due to scope changes, inflation, permitting, and execution risk.
| Company | Planned mt LCE Capacity | CapEx | CapEx/mt of LCE | Operation Type | Company Origin | Operations |
|---|---|---|---|---|---|---|
| Tibet Summit Resources | 150,000 | $2,100,000,000 | $14,000 | Direct Lithium Extraction (DLE) | China | Argentina |
| Lithium Harvest | $17,100 | Direct Lithium Extraction (DLE) | Denmark | North America | ||
| Zijin Mining Group Company Limited | 20,000 | $370,551,000 | $18,528 | Direct Lithium Extraction (DLE) | China | Argentina |
| CleanTech Lithium | 20,000 | $450,000,000 | $22,500 | Direct Lithium Extraction (DLE) | UK | Bolivia |
| SIMCO LITHIUM | 20,000 | $546,000,000 | $27,300 | Direct Lithium Extraction (DLE) | Chile | Chile |
| EnergyX | Not disclosed | Not disclosed | $28,500 | Direct Lithium Extraction (DLE) | US | Chile |
| Pure Energy Minerals | 10,300 | $297,000,000 | $28,835 | Direct Lithium Extraction (DLE) | Canada | US |
| Grounded lithium | 11,000 | $335,000,000 | $30,455 | Direct Lithium Extraction (DLE) | Canada | Canada |
| Eramet | 24,000 | $735,000,000 | $30,625 | Direct Lithium Extraction (DLE) | France | Argentina |
| Power Minerals Limited | 7,061 | $216,550,000 | $30,668 | Direct Lithium Extraction (DLE) | Australia | Argentina |
| Alpha Lithium (Tecpetrol) | 25,000 | $777,000,000 | $31,080 | Direct Lithium Extraction (DLE) | Canada | Argentina |
| Anson Resources | 13,074 | $495,000,000 | $37,861 | Direct Lithium Extraction (DLE) | Australia | US |
| Exxon Mobil | 50,000 | $2,000,000,000 | $40,000 | Direct Lithium Extraction (DLE) | US | US |
| Rio Tinto | 60,000 | $2,500,000,000 | $41,667 | Direct Lithium Extraction (DLE) | UK | Argentina |
| EMP Metals | 12,175 | $571,000,000 | $46,899 | Direct Lithium Extraction (DLE) | Canada | Canada |
| Arizona Lithium | 6,000 | $290,000,000 | $48,333 | Direct Lithium Extraction (DLE) | Australia | Canada |
| Lake Resources | 25,000 | $1,380,000,000 | $55,200 | Direct Lithium Extraction (DLE) | Australia | Argentina |
| Vulcan Energy | 24,000 | $1,390,000,000 | $57,917 | Direct Lithium Extraction (DLE) | Australia | Germany |
| Lithium Bank | 34,000 | $2,160,000,000 | $63,529 | Direct Lithium Extraction (DLE) | Canada | Canada |
| Standard Lithium SWA | 22,400 | $1,450,000,000 | $64,732 | Direct Lithium Extraction (DLE) | Canada | US |
| Standard Lithium Phase 1A | 5,400 | $365,000,000 | $67,593 | Direct Lithium Extraction (DLE) | Canada | US |
| LibertyStream Infrastructure Partners Inc. (Volt) | 23,031 | $1,549,000,000 | $67,257 | Direct Lithium Extraction (DLE) | Canada | US |
| E3 Lithium | 32,250 | $2,470,000,000 | $76,589 | Direct Lithium Extraction (DLE) | Canada | Canada |
OpEx Benchmark
OpEx Position on Peers’ Lithium Cost Curve
Bottom-decile cost profile with clear resilience. On a volume-weighted, plant-gate LCE cost curve built from the provided dataset (95 projects; 3.85 Mtpa), Lithium Harvest’s cash operating cost is $3,647/t LCE. The market’s weighted P50/P75/P90 sit at $7,443/$11,300/$20,100 per tonne. At this level, Lithium Harvest plots around the 2nd percentile on the global cost curve.
Investor Takeaway: Lithium Harvest operates well below the market median and below the medians of all major extraction routes. This cost position supports strong free-cash conversion across price scenarios, improves contractability with tier-one buyers, and reduces reliance on high prices to meet return thresholds.
Conclusion: Lithium Harvest operates well within the bottom decile of peers’ operating costs, with meaningful headroom to market-clearing levels, positioning the company for durable margins and disciplined growth.


Our Feedstock Advantage
Waste Streams Into Bankable Supply - Fast, Local, De-Risked
Transforming produced water and geothermal brines into carbon-neutral, battery-grade lithium faster and cheaper than any green or brown field mine. Where others hunt for new deposits, we tap what already flows at an industrial scale. Our plants co-locate on two continuous brine sources:
Produced Water - Abundant, Forecast-Proof Feedstock
- Oil & gas operations generate 2-6 bbl of produced water for every barrel of oil produced - a lithium-rich waste stream which is seen as a cost center.
- Global oil demand is set to increase from 102 mb/d (2023) to 120 mb/d by 2050 (+18%), implying a proportional lift in produced-water volumes - larger than any conventional lithium resource.
- Surface access = no drilling, no evaporation ponds, fixed price feedstock - one of the lowest CapEx/OpEx profiles in the lithium sector
Geothermal Brines - Power + Critical Minerals in One Loop
- Conventional geothermal capacity is on track to grow ~50% from ~15 GW (2023) to ~22 GW by 2030 and to ~60 GW by 2050.
- Rising throughput means brine flow is projected to triple between 2023 and 2050, creating a second, dispatchable feedstock with built-in renewable power.
Why These Fluids Win
- Abundant & forecast-proof: Volumes are tied to long-life oilfields and expanding geothermal capacity - not speculative greenfield exploration.
- At-surface access: No new pits, no evaporation ponds, no long haul to refineries. We “bring the plant to the brine,” cutting lead time and logistics risk.
- Infrastructure leverage: Pads, power, roads, water handling, injection permits already in place → lower CapEx, faster schedules, easier permits.
- Local, secure supply: Local and domestic diversified supply reduces exposure to centralized global bottlenecks. Diversify supply away from Australia-Chile-China dominance.
- Fast to cash flow: Modular lithium extraction begins production in 12-18 months, not 5-17 years for new mines.
- ESG upside: Turning a liability into lithium products minimizes land, emission, and freshwater draw; polished brine is reinjected or beneficial reuse - waste-to-value by design.
Data-Driven Site Selection
Backed by public programs (Danish Eco-Innovation Programme (MUDP) under the Danish Ministry of the Environment) and a database of ~200,000 water samples, we target the best brine streams by grade, chemistry, flow, and proximity to demand. Our pretreatment and adsorption DLE handles varied chemistries across produced water and geothermal applications. Ongoing R&D also evaluates multi-mineral recovery (e.g., Mg) to lift project value.
Integrated Upside for Oil & Renewables
- Not a replacement, an add-on. Even under aggressive climate scenarios, oil remains ~50% of the energy mix in 2050; we monetize its wastewater into lithium without requiring new drilling. EVs shave only ~5% of oil demand.
- Cash flow + growth. Midstream infrastructure keeps throwing off returns while funding rapid, modular lithium expansion.
- Strategic security. Domestic fluids diversify supply away from Australia, Chile, and China, reducing geopolitical and ESG risks.
- Integrated upside. One value chain funds the other: legacy infrastructure monetizes the clean-tech boom while cutting the cost and CO₂ of critical mineral supply.
Investor Takeaway: Existing flows + existing infrastructure = speed, scalability, and security. Produced water and geothermal brines provide Lithium Harvest with a large, local, policy-aligned resource base that can be monetized within 12-18 months, and sold into premium offtakes seeking low-impact, regionally sourced lithium.
What Sets Us Apart
Our moat is a combination of protected process IP, surface-feedstock access, proprietary full-process water-treatment expertise, and an on-site DBOO model. Together, these advantages create a system that is faster to build, cheaper to operate, and structurally more complex to replicate and built for lower CapEx/OpEx - delivering superior project economics and long-term defensibility.
-
Our Moat Is Real & IP-Protected
Unlike many direct lithium extraction (DLE) companies, which are still in pilot phases or focused solely on the DLE step, Lithium Harvest is built differently. We own an IP-protected, end-to-end process for extracting lithium from oilfield wastewater, including pre-treatment, DLE, and post-treatment, all tuned for surface-level feedstock. This is not generic DLE. It is a fully integrated, highly engineered system refined over decades of real-world operational experience.
-
We’re Water Engineers, Not Mining Theorists
While most lithium startups are built by geologists or financiers and struggle with scale-up, our team brings 20+ years of water-treatment deployment and over 400 full-scale systems installed across the oil & gas and industrial sectors. We have worked with every technology we use in our flow sheet, not in lab pilots, but in full-scale, high-uptime environments. That experience gives us unmatched expertise in:
- Conditioning complex brines to maximize lithium yield
- Control fouling, scaling, and other performance-killing risks
- Managing resin life, media performance, and system balance
- Integrating unit operations into a fully optimized, low-cost lithium extraction solution.
This deep operational knowledge enables us to achieve battery-grade consistency and project-level value where others typically struggle.
-
Designed, Built, & Operated In-House
We do not outsource to engineering firms that use generic templates and have conflicting incentives. Our systems are designed, engineered, built, and operated in-house. This gives us tighter control over:
- Lower CapEx through lean, fit-for-purpose design
- Faster troubleshooting and performance tuning
- Operational knowledge retained on-site, not lost in handovers
Our Design-Build-Own-Operate (DBOO) model ensures cost discipline, operational control, and long-term asset performance - critical for project economics and investor returns.
(Note: Most competitors must contract third-party engineers who bring their own preferences and agendas. They must also determine who operates what, understand how it works, and learn how to fix it when it breaks. Every system is different - and that is where things often go wrong. Our integrated approach avoids this entirely.)
-
Integration Is Our Superpower
In DLE, success is not just about the extraction technology - it is about how you integrate all the upstream and downstream steps. Poor pre-treatment or inadequate refining can ruin recovery rates or disqualify the product for battery use. Many DLE players optimize the “DLE box” and underestimate pre- and post-treatment; we do not. We have built our system to optimize every stage - because the value lies not just in recovering lithium, but in qualifying product and minimizing losses at every step. This is why we achieve higher project value per tonne of lithium.
-
Why Is This Hard to Copy
- IP barrier - Patent-protected process for extracting and refining lithium from oilfield wastewater
- Tacit know-how - Brine conditioning, resin chemistry, and fouling management cannot be fast-tracked
- Systems integration - A tuned, interoperable process train takes years to develop, not months
- DBOO operating model - On-site, integrated delivery removes layers of third-party risk and cost
- Offtake Stickiness - Battery-grade qualification creates high switching costs; once qualified, producers rarely change suppliers
Execution & Growth
Alberta Lithium Project
This project targets lithium extraction from geothermal water integrated with a new-build geothermal heating plant. It is being developed under a DBOO structure with royalties for feedstock in partnership with two geothermal operators.
Target first production is Q1 2027.
Sustainability metrics: At full run-rate, Alberta avoids ~109.7 kt CO₂ per year - roughly ~23,800 cars off the road. It also avoids ~211 million ft² of land disturbance (~3,667 football fields) and ~517 million gallons of freshwater (~18,117 pools) annually.

Alberta Lithium Project |
|
|---|---|
| Location | Alberta, Canada |
| *Nominal production | 5,376 (tpa LCE) |
| Feed | Geothermal brine |
| *Volume | 226,000 bbl/d |
| Concentration | 98 ppm |
| Total CapEx | $64.3M |
| *Revenue | $88.8M |
| *Gross margin | 69% |
| *Payback period | 1.05 years |
Alberta Lithium Project
ND I Lithium Project
The project recovers lithium from produced water under a DBOO model with royalties for feedstock. The project is being developed with a US midstream energy provider.
Target first production is Q4 2027.
Sustainability metrics: ND I avoids ~28 kt CO₂ per year - equivalent to ~6,100 cars off the road. It also avoids ~54 million ft² of land disturbance (~937 football fields) and ~132.1 million gallons of freshwater (~4,630 pools) each year.

ND I Lithium Project |
|
|---|---|
| Location | ND, US |
| *Nominal production | 1,374 (tpa LCE) |
| Feed | Produced water |
| *Volume | 48,000 bbl/d |
| Concentration | 118 ppm |
| Total CapEx | $25.9M |
| *Revenue | $22.7M |
| *Gross margin | 60% |
| *Payback period | 1.92 years |
ND I Lithium Project
ND II Lithium Project
Our second North Dakota project mirrors the DBOO model, extracting lithium from produced water with a royalty-based feedstock structure. It was likewise originated with a US midstream energy provider.
Target first production is Q4 2027.
Sustainability metrics: ND II avoids ~32.4 kt CO₂ per year - about ~7,000 cars off the road. It also avoids ~62.4 million ft² of land disturbance (~1,083 football fields) and ~152.6 million gallons of freshwater (~5,348 pools) annually.
ND II Lithium Project |
|
|---|---|
| Location | ND, US |
| *Nominal production | 1,587 (tpa LCE) |
| Feed | Produced water |
| *Volume | 60,000 bbl/d |
| Concentration | 109 ppm |
| Total CapEx | $32.8M |
| *Revenue | $26.2M |
| *Gross margin | 77% |
| *Payback period | 1.62 years |
ND II Lithium Project


Growth Strategy
Capital-Light. Speed-Focused. Market-First.
To fully capitalize on accelerating lithium demand, our growth strategy is simple: scale ahead of the next demand step-up and capture the spread. We will deploy low-cost, modular extraction units at pace, secure long-term offtake to de-risk revenue, and recycle early cash generation into new facilities. In the build years, EBITDA/CapEx improves from -0.11 (2026) to 1.03 (2028), then stays around ~2.0x through the scale phase, peaking at 3.12x (2029). Cumulatively, EBITDA/CapEx reaches 1.20x in 2026-2030 and 1.98x in 2031-2036, for 1.85x over 2026-2036 as realized pricing and contracted volumes ramp.
- Build-phase (2026–2030): CapEx $231.0m, EBITDA $276.1m, EBITDA/CapEx ~1.20x
- Scale-phase (2031–2036): CapEx $1,155.6m, EBITDA $2,284.5m, EBITDA/CapEx ~1.98x
- Total (2026–2036): CapEx $1,386.6m, EBITDA $2,560.6m, EBITDA/CapEx ~1.85x
1. Expand Manufacturing Capacity at Speed
Standard DBOO train, surface-based feedstock replicated across sites; detailed schedules sit in the project section.
2. Invest Ahead of the Curve
We deliberately trade near-term cash flow for long-term advantage in 2026-2028 to secure supply, customers, and first-mover benefits.
- Trade near-term cash flow for long-term market position and offtake economics
- Improve offtake quality with scale: larger, predictable blocks increase tenor and price certainty
- Lock in low-cost production advantages
- Establish a multi-year lead over slower-to-scale competitors
3. Reinvest Profits to Maximize Long-Term Value
- Reinvestment flywheel: Early EBITDA funds additional trains, site development, and process optimization
- Operating leverage: Modular, co-located plants minimize fixed cost; from 2028 onward, revenue growth outpaces CapEx in the model
- R&D priorities: Purity and recovery improvements, multi-mineral potential to enhance offtake quality and resilience
Commercial edge: Streamlined deal-to-sale execution
4. Secure Strategic Position in Global Lithium Market
With a 2-5 year operational head start, we expect a multi-year advantage due to our speed to market, low CapEx per ton, and sustainability leadership.
- First-mover advantage: Commercial operational systems reduce buyer adoption risk and shorten diligence cycles
- Preferred supplier status: EV, battery, and storage buyers favor bankable scale and reliable specs
- ESG premium: low-impact footprint supports pricing, access to incentives, and policy alignment
Future Growth Projects
-
Mobile Site-Validation Unit (SVU)
Role in growth plan: Site-specific validation to convert prospects into bankable DBOO projects with performance guarantees.
Objective: Generate decision-grade operating and integration data on partner brines to underpin design, guarantees, and offtake terms for the first commercial unit at each site.
What the SVU Establishes
- Tailored validation - every brine is different. We optimize recovery, product pathway, and economics for your water stream.
- Faster decisions - weeks of operating data, not years, to move to full-scale DBOO.
- De-risked investment - real performance and sustainability data smooth partner and investor approvals.
- Scalable by design - a scaled-down commercial plant, so results translate directly with no surprises.
- Integration clarity - confirms tie-ins, footprint, utilities, HSE procedures, and site automation needs.
- Digital-twin ready - SVU data calibrates the digital twin for accurate scaling, OpEx modeling, and precise project economics.
Bottom line: A commercial readiness trial that finalizes the design, guarantees, and revenue model - so we can advance to full-scale with partners in confidence.
-
Digital Twin
Role in growth plan: Rapid, site-specific engineering and economics with fewer physical iterations.
Objective: Use a calibrated digital twin to translate a water analysis into a defensible process design and business case in hours. The model specifies expected recovery, product pathway, energy use, reagent consumption, and utilities, minimizing the need for extended piloting.
What the Digital Twin Delivers
- Process specification from brine samples: Mass and energy balance, operating envelope, and product quality pathway.
- Fast techno-economics: OpEx corridor, key CapEx drivers, and sensitivity to flow, grade, and impurity load.
- Scale-up integrity: Alignment between lab, SVU campaigns, and commercial plant, so theory and field performance converge.
Why Is It Value-Accretive
- Shorter path from brine samples to term sheet and DBOO decision.
- Fewer and shorter pilot campaigns, with targeted test plans.
- Better capital discipline through scenario analysis before FID.
Bottom line: A calibrated digital twin transforms a brine sample analysis into an engineered flowsheet and defendable unit economics in hours, shrinking piloting, improving first-time-right performance, and derisking FID.
-
Other Critical Minerals
Role in growth plan: Optionality and margin expansion where brine chemistry and offtake justify CapEx.
Objective: Develop selective co-recovery modules for high-value minerals in partner brines, with an initial focus on magnesium. Use site screening to add co-products only where grades, flows, and offtake economics clear our IRR threshold.
Why Magnesium First
- Strong commercial pull: External forecasts indicate the magnesium metal market could reach about USD 10.7 billion by 2034 from USD 5.4 billion in 2024 at ~7.1 percent CAGR.
- Lightweighting demand: Replacing cast iron and traditional steel with magnesium and other light alloys can reduce body and chassis weight significantly, supporting fuel savings and EV range gains.
- Chemistry fit: Many produced waters and geothermal brines contain meaningful Mg that can be recovered with targeted separation.
Approach & Scope
- Technology pathway: Leverage our separation and water treatment stack to evaluate sorption, membrane, and crystallization routes for Mg and, where viable, other minerals such as rare earth elements and germanium in different brine sources.
- Integration: Co-recovery sits as an add-on to the lithium flowsheet. It reuses brine handling, utilities, and controls to keep incremental CapEx and footprint low.
Bottom line: Co-recovery is an options strategy, not a mandate. Magnesium leads due to market pull and chemistry fit. We will add modules only where site data and contracted demand produce risk-adjusted returns that lift $/barrel and preserve capital discipline.
-
Expand Lithium Chemical Portfolio
Role in growth plan: Sequence products for margin and market fit. Start with lithium carbonate; add lithium hydroxide when the customer mix justifies it.
Why Lithium Carbonate First
- Process simplicity and cost: carbonate is produced directly from brines via LiCl + soda ash, while hydroxide typically adds a carbonate-to-hydroxide conversion step with lime, increasing reagents and residuals.
- Demand alignment: LFP and other low-Ni chemistries continue to gain share globally, strengthening the case for carbonate-led output.
Where Lithium Hydroxide Fits
- Customer pull: high-Ni NMC/NCA cathodes for high-end, larger or longer-range vehicles in Europe and the US maintain a structural need for hydroxide; sequencing preserves the option to add hydroxide capacity as contracts materialize.
Sequencing Logic
- Producing carbonate first allows immediate revenue capture at lower cost, while postponing hydroxide production provides the flexibility to respond to market recovery or niche demand without committing upfront to a higher-cost route.
Bottom line: Lead with carbonate to match today’s chemistry mix, cost curve, and time-to-cash, while engineering the plant for an efficient hydroxide add-on once customer pull and margins justify the step-up. The sequencing preserves capital discipline and expands addressable demand as market shares evolve.
-
Battery Recycling
Role in growth plan: CapEx-light adjacency that monetizes lithium and de-risks wastewater at partner recycling plants, using our separation and water-treatment expertise.
Objective: Provide modular process-water solutions that recover lithium from recycling circuits and close water loops while meeting strict discharge limits for inorganic fluorides.
Where We Create Value
- Lithium recovery from multiple aqueous streams in the recycling flow sheet, for example: Wash streams from black-mass leaching, critical wash water recovery, and electrolyte waste streams.
- Compliance and ESG: targeted removal of inorganic fluoride before discharge or reuse.
Bottom line: A partner-led, CapEx-light entry that turns recycling wastewater from a liability into value: recover lithium where it pencils, meet inorganic fluoride limits, close water loops, and capture shared economics.
The World's Most Sustainable Lithium
Investment Memorandum
-
Strategy, market thesis, and growth plan distilled into a single, investor-ready brief.
-
Full operating model and ramp schedule with key assumptions, sensitivities, and unit economics.
-
Project pipeline, timelines, and commercialization plan, plus risk factors and mitigations.
-
Team, governance, and finance overview for diligence preparation.
Please download our 2025 Investment Memorandum to review our strategy, market opportunity, financial model, projects, and team in detail.
Download PDF, 4.32 MBLet’s Continue the Conversation
-

Sune Mathiesen
- Chairman & CEO
- +1 713 887 0751
- sma@lithiumharvest.com
