The Lithium Mining Market
Discover the booming lithium market driven by EVs and renewable energy as demand surges and supply chains evolve.
Introduction
Lithium has shifted from specialty metal to the backbone of electrification. Batteries for cars and the grid are the main growth engines, but supply chains weren’t built for this speed. Most raw lithium still comes from three countries, and most refining happens in one - a setup that’s efficient on paper but fragile in practice.
This page explains the market in plain language: the demand surge, where supply really comes from, what delays new projects, and how alternatives like DLE from produced water and geothermal brine can ease bottlenecks with a smaller footprint.
Table of contents:
- No Energy Transition Without Lithium
- Lithium Supply Chains Are Failing the Energy Transition
- A Looming Lithium Deficit
- Insights from CERAWEEK 2025
- Lithium Demand Drivers
- Market & Customers' Preferences
- Applications and Market Segments for Lithium
- Lithium Compounds in the Market
- Different Lithium Battery Types
- Lithium Extraction Technologies
- Regulatory Tailwinds Are Real
- Industry Outlook and Predictions
No Energy Transition Without Lithium
Lithium has moved from a specialty metal to a critical input for global electrification. Here’s why it matters now - and why a smarter, cleaner supply is urgent.
Electrification needs lithium
- EVs and batteries run on lithium. More than 1 in 5 new cars sold in 2024 were electric, with EV sales topping ~17 million and momentum building into 2025.
- Batteries dominate lithium demand. EVs and grid storage already absorb ~61% of new lithium demand, and this is projected to rise to ~81% by 2030.
Demand is rising fast
- Lithium use grew nearly 30% in 2024 as EVs and grid batteries scaled. Prices fell from 2021-22 peaks as supply rose, but underlying demand growth remains strong.
Supply is concentrated - especially in refining
- Processing is the chokepoint. Across key battery minerals, the top three refining countries supplied ~86% of output in 2024 (up from ~82% in 2020).
- Lithium mining and refining are concentrated too, with the top three producers at ~77% in 2024; ~70% of refining sits in one country (China). A high concentration raises the energy security risk if any central hub is disrupted.
Policy and investment are shifting to minerals - but not enough
- We’re in the age of electricity. Global energy investment is set to reach ~USD 3.3 trillion in 2025, with ~USD 2.2 trillion going to clean energy, grids, storage, and electrification - roughly 2x fossil fuels.
- But mining spending lags the need. Meeting forecast demand requires ~USD 500-600 billion in new mine CapEx by 2040. 2024 investment momentum softened to ~+5% - a warning sign for future supply.
- Governments are responding. 35+ countries with critical minerals policies. Lithium is explicitly listed as strategic/critical by the EU, the United States, Canada, and other countries.
What it means
- Mineral security is energy security. As EVs scale, resilient, lower-impact lithium supply chains become the limiting factor - not consumer interest.
- Solutions exist. Diversifying sources and technologies - including Direct Lithium Extraction and recovery from alternative brines such as produced water and geothermal brine - can provide a local, faster-to-market supply with a smaller footprint when done right.

World (Countries) |
United States |
Canada |
EU |
|
|---|---|---|---|---|
| Critical Minerals | United States, Canada, European Union, United Kingdom, Australia, Japan, South Korea, India, Chile, Bolivia, Mexico (Several other countries have taken steps recognizing lithium’s importance, though not always via formal designations in law). | Aluminum, Antimony, Barite, Beryllium, Bismuth, Cerium, Cesium, Chromium, Cobalt, Copper, Dysprosium, Erbium, Europium, Fluorspar, Gadolinium, Gallium, Germanium, Graphite, Hafnium, Holmium, Indium, Iridium, Lanthanum, Lead, Lithium, Lutetium, Magnesium, Manganese, Neodymium, Nickel, Niobium, Palladium, Platinum, Potash, Praseodymium, Rhenium, Rhodium, Rubidium, Ruthenium, Samarium, Scandium, Silicon, Silver, Tantalum, Terbium, Thulium, Tin, Titanium, Tungsten, Vanadium, Ytterbium, Yttrium, Zinc, Zirconium. | Aluminum, Antimony, Bismuth, Cesium, Chromium, Cobalt, Copper, Fluorspar, Gallium, Germanium, Graphite, Helium, High-purity iron ore, Indium, Lithium, Magnesium, Manganese, Molybdenum, Nickel, Niobium, Phosphorus, Platinum group metals, Potash, Rare earth elements, Scandium, Silicon metal, Tantalum, Tellurium, Tin, Titanium, Tungsten, Uranium, Vanadium, Zinc. | Coking Coal, Phosphorus, Antimony, Feldspar, Scandium, Arsenic, Fluorspar, Magnesium, Baryte, Strontium, Beryllium, Tantalum, Hafnium, Niobium, Helium, Phosphate Rock, Vanadium. |
| Strategic Minerals | Aluminium/Bauxite/alumina, Lithium, Light rare earth elements, Silicon metal, Gallium, Manganese, Germanium, Natural Graphite, Bismuth, Titanium metal, Boron, Platinum group metals, Tungsten, Cobalt, Heavy rare earth elements, Copper, Nickel. |
World (Countries)
United States
Canada
EU
Lithium Supply Chains Are Failing the Energy Transition
Battery demand is growing at 21st-century speed. Mining and refining still follow 20th-century playbooks. Four facts make that clear.
Too concentrated to be resilient
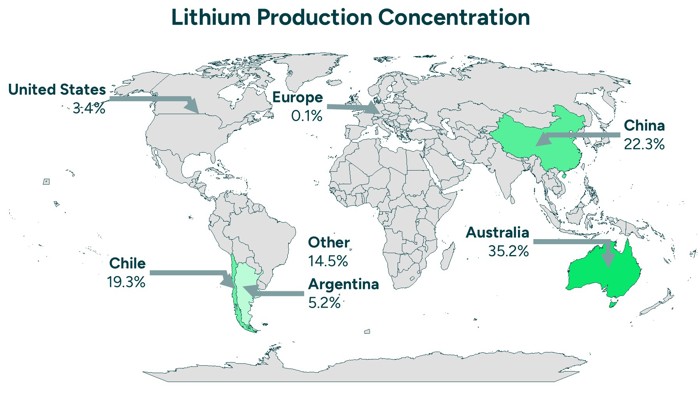
- 77% of raw lithium still comes from just three countries: Australia 35.2%, Chile 19.3%, China 22.3%.
- Refining is tighter still: 70% of lithium chemicals are refined in China; add Argentina and Chile, and the top three reach 95%. North America and Europe together hold 2-3% of global capacity.
- Across 19 of 20 key transition minerals, China is the largest refiner with an average ~70% share. Lithium refining concentration has increased since 2020 and is expected to remain >80% through 2035. A single weather, labor, or geopolitical shock can move global battery security.
Traditional supply is too slow to catch up
- 66% of today’s lithium comes from hard-rock mines that typically need 10-17 years from discovery to first ton. Evaporation-pond brines take 13-15 years to ramp.
- Traditional methods = 89% of supply (hard-rock + evaporation brines).
- Demand jumped ~30% in 2024 - triple the 2010s average - yet mining-sector CapEx rose just 2%. Even if every announced project lands on time, a mid-decade shortfall looms. You can’t run the energy transition on decade-long build cycles.
Missed opportunity in secondary brines
- Traditional DLE supplied only ~11% of global output in 2024.
- Oilfield wastewater and geothermal brines are forecast to add just ~110 kt LCE by 2035 - less than 3% of projected demand - because few ventures align technology, feedstock rights, and capital in a single package. The gap isn’t theoretical - it’s executional.
Corporate power is consolidating
- Five upstream producers - SQM, Albemarle, Tianqi, Pilbara Minerals, and Rio Tinto - already control nearly 70% of output.
- When one flagship asset hiccups, prices and availability ripple across the entire battery chain.
What it means
Traditional supply is too centralized, too slow, and too inflexible to keep pace with global demand. Diversified, local, sustainable sources are the only credible bridge between legislated demand and physical availability.
A Looming Lithium Deficit
A massive supply gap is looming, and projects cannot keep pace.
Lithium is the “lifeblood” of electric-mobility and stationary-storage batteries, making it a focal point of both opportunity and concern on the road to 2030 and 2040. EV mandates, grid storage targets, and carbon-neutral pledges make lithium demand a policy certainty, not just a market option. What is uncertain is how quickly supply can be brought online.
The transition to electric mobility and renewable energy is driving exponential growth in lithium demand through 2030 and beyond. Yet today’s supply chain is already stretched thin - marked by near-100% utilization of current operating capacity and price volatility. Without a massive and sustained build-out of new supply infrastructure, the world faces a growing shortfall. Analysts warn that by 2029, deficits could reach thousands of tons of lithium carbonate equivalent (LCE). By 2040, the gap could widen to several million tons per year - jeopardizing the acceleration of the energy transition.
While lithium resources are geologically abundant, the bottleneck lies in bringing economically and environmentally viable projects online. Much of the required future supply must come from ventures that have not yet been built, or even discovered, including secondary sources such as oilfield and geothermal brines. Complicating matters, the recent drop in lithium prices risks dampening near-term investment in new capacity, setting the stage for a more resounding supply crunch later this decade. The mining industry is cyclical, and if investment lags in the next few years, the long-term shortfall could be severe just as EV demand reaches its peak growth.
Bottom line: The long-term outlook depends on fast-tracking projects not yet on the map. The clock is ticking.
Demand is exploding - and it is structural
- 2024: Demand jumped ~30% year-on-year - triple the growth pace of the 2010s.
- 2030: Analyst consensus forecasts call for 2-3x 2024 demand, implying a CAGR of 15.7%.
- 2035: Most analysts converge on 3.5-4.2x 2024 levels,
- By 2040, lithium demand exceeds today’s level by 4.7-5.5x in high-adoption scenarios - a CAGR of 10% from 2024.
- EV & BESS are already 61% of consumption and will exceed 90% of lithium demand by 2040; that share is locked in by policy and automaker commitments.
Supply: Slow, capital-starved, at risk
- 2024 balance: Roughly 1.15 Mt LCE of supply met 1.15 Mt of demand, but this balance is fragile.
- Pipeline reality: Even if every announced project is built, supply covers only ~85% of demand in 2029 (55-445 kt LCE/yr shortfall), 70-83% in 2035, and 65-75% by 2040.
- Project attrition: 11-13 lithium projects - mostly high-CapEx, mid-to-high OpEx hard-rock mines totaling 150-282 kt LCE per year - have been cancelled or postponed due to market conditions. Weaker prices, billion-dollar upfront costs, mid-tier operating margins, and tough permitting have made them unbankable. Strip those tons from the pipeline, and today’s “surplus” turns into a deficit several years earlier than consensus models suggest.
- Execution drag: Hard-rock mining averages 10-17 years from discovery to first ton; brine ponds, 13-15 years. Meanwhile, mining CapEx rose only 2% in 2024, and exploration spending has stalled at approximately USD 6.7 billion.
When the gap opens - and how wide
- Base-case deficit: Begins 2029 (-55 kt LCE), widens to -700 kt by 2035 and -1300 kt by 2040.
- High-demand scenario: Shortfall is 450 kt by 2029, 1450 kt by 2035, and 2200 kt by 2040.
Why the shortfall arrives sooner than models suggest
- Long lead times: Two-thirds of supply still comes from hard-rock mines that need 10-17 years to permit and build. In 2022, mass public protests led Serbia’s government to revoke Rio Tinto’s Jadar exploration license. Although the Constitutional Court overturned the decision in 2024, the project still suffered a two-year delay.
- Capital hesitation: Mine CapEx rose just 2% in 2024, even as demand soared; exploration spending has plateaued. Low prices in 2024-25 mute investment precisely when new projects should break ground for late-decade delivery.
- Execution risk: Oilfield and geothermal brines could be rapid, low-carbon sources, yet they are expected to meet <3% of 2035 demand because most DLE ventures lack the trio of proven tech, feedstock rights, and project finance.
Abundant geology ≠ guaranteed supply
Global reserves (~120-140 Mt LCE) are theoretically enough for billions of EVs, but fewer than 1 in 10 tons are permitted or under development. ESG constraints, water scarcity, low grades, financing, and community opposition mean geology is the easy part - execution is not.

Insights from CERAWeek 2025
Lithium demand is surging - are we ready for what comes next? Sune Mathiesen on the growing supply gap.
At CERAWeek 2025, our CEO, Sune Mathiesen, joined the global conversation on the urgent need for scalable lithium solutions. In this short video, he explains the accelerating demand, the looming supply gap, and why traditional mining methods won't be enough to meet future needs.
Lithium Demand Drivers
EV growth is transformational
Electric vehicles (EVs) are the single largest driver of lithium demand:
- Sales momentum: 17.1 million EVs sold in 2024, on track for 40 million by 2030 (+233%). EV sales are set to exceed 20 million in 2025, with Q1-2025 sales up 25% YoY.
- Market penetration: EV share is set to increase from 22% (2024) to 42% (2030).
- Fleet build-out: Global EV fleet is set to grow from 58 million (2024) to 235 million (2030) and >500 million by 2035 (~850% expansion).
- Battery pull-through: Pack demand is set to scale from 840 GWh in 2024 to ~2,600 GWh by 2030 (3x).
- Lithium impact: EV batteries alone are set to lift lithium use from ~0.7 Mt LCE (2023) to ~3 Mt by 2030 - a 338% surge.
- Economics, not subsidies: Consumer spend hit USD 560 billion in 2024 while subsidies fell to <7% of outlays (20% in 2017). Price parity and model choice (with more than 1,000 expected by 2026) now drive adoption.
Energy storage: The next big thing?
- Capacity surge: BESS installations are set to increase from 205 GWh (2024) to 520-700 GWh (2030), a 2.5-3.5x increase.
- Cost tailwind: Levelized cost of storage is predicted to decrease ~60% (US$0.05 → <0.02/kWh), unlocking utility and residential uptake.
- Share of demand: By 2030, storage alone could absorb ~10% of global lithium.
- System criticality: BESS enables integration of variable renewables and strengthens grid reliability.
Electrification everywhere
Heavy fleets, two-wheelers, heat pumps, portable electronics, short-haul flights, robots, coastal marine vessels, and industrial vehicles all add incremental pull. With EVs and BESS already at 61% of lithium use - and set to exceed 90% by 2040 - the chemistry’s dominance is locked in.
What it means
This is structural, not cyclical. Lithium demand is being driven by infrastructure, electrification, and economics - not just sentiment. EVs and BESS already account for 61% of lithium use and are projected to exceed 90% by 2040. Every credible net-zero pathway requires multiple-fold growth in these sectors, making lithium the throughput mineral of the energy transition.
Market & Customers Preferences
Sustainability has shifted from a marketing claim to a buy/no-buy gate and a pricing lever. Traceable, low-impact, regionally sourced lithium secures contracts more quickly, commands premiums, and taps into subsidy pools.
-
What buyers insist on now
- Up-front ESG screens. Auto- and battery manufacturers evaluate climate, water, labor, and traceability before signing offtakes. The EU Battery Regulation formalizes this via mandatory due diligence and “battery passports” for lithium, nickel, cobalt, and graphite, as well as battery passports and recycled-content targets.
- Traceability as a feature. Companies use verifiable chain-of-custody data to unlock incentives, de-risk brand exposure, and justify price differentials.
-
Market perception & signaling
- EV mainstreaming. Public charging points have doubled since 2022, and EV model availability is on track to exceed 1,000 by 2026 - momentum that brings upstream impacts into the spotlight for OEMs, regulators, and consumers.
- Table-stakes transparency. Stakeholders highlight risks associated with weak environmental and social practices in parts of the mining chain; credible transparency and third-party verification are becoming essential for OEMs and financiers.
-
Risk & resilience filters
- Water & carbon risk matter. Droughts, floods, and carbon pricing poses threats to high-impact mines; low-water, low-carbon projects are structurally safer bets.
- Circularity readiness. EU rules mandate recycled content and audit trails; suppliers that can feed closed-loop systems gain priority access to premium markets.
-
Supply-chain security & geopolitics
- Diversification is policy. Critical-mineral acts and offtake funds in the US, EU, and Canada steer purchasing away from single-country dependence.
- Responsible tons = competitive edge. OEMs and financiers channel capital to projects that tick the ESG, localization, and transparency boxes, penalizing traditional, high-impact supply chains.
Applications and Market Segments for Lithium
In recent years, lithium has become indispensable in a wide range of industries, including batteries, ceramics, glass, lubricating greases, air treatment systems, and casting powders. But lithium’s most significant growth driver is its use in batteries, especially for electric vehicles (EVs), consumer electronics, and energy storage systems.
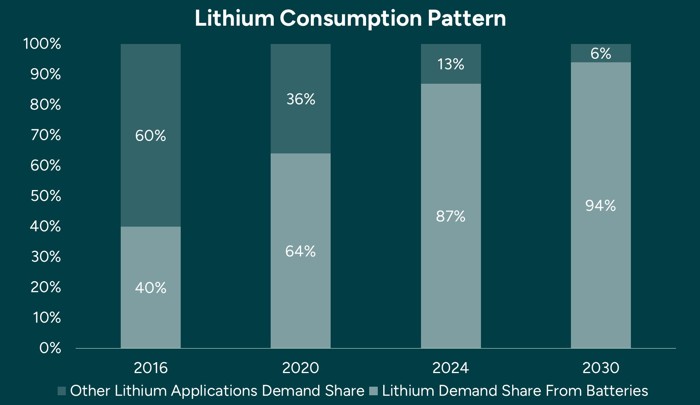
By 2024, batteries accounted for 87% of total lithium consumption, up from 40% in 2016. This dramatic shift is primarily driven by the explosive growth of the electric vehicle (EV) market, where rechargeable lithium-ion batteries have become the standard due to their lightweight design and high energy density. Since 2016, global lithium consumption has nearly tripled, with batteries fueling most of that growth.
Lithium’s unique properties make it ideal for modern battery technology. It’s lightweight, energy-dense, and offers a long cycle life, making it the go-to material for powering electric vehicles (EVs) and other high-performance systems. And demand is only set to climb: By 2030, batteries are expected to account for 94% of global lithium use, with all other applications making up just 6%.
Evolution of lithium demand
The evolution of lithium demand tells a clear story - batteries have become the dominant driver of growth. This rapid shift highlights lithium’s critical role in electrifying transportation and enabling clean energy storage. As the push to decarbonize intensifies, lithium’s role in powering the green energy revolution is more secure than ever.
Lithium Compounds in the Market
Today, the two most commonly used lithium compounds are lithium carbonate and lithium hydroxide, both of which are essential for battery production.
Lithium carbonate is the primary compound used to manufacture materials for lithium-ion batteries, making it the dominant player in the market.
Lithium hydroxide, meanwhile, is gaining importance as NMC (nickel-manganese-cobalt) batteries capture a larger share of the electric vehicle (EV) market. These batteries offer higher energy density and better performance, particularly for electric vehicles, which has driven up demand for lithium hydroxide.
In addition to these key compounds, spodumene concentrate is widely used as a feedstock for producing both lithium carbonate and hydroxide. Lithium chloride also plays a role, although to a lesser extent, particularly in specific niche applications such as air treatment and lubricating greases.
Usage |
|
|---|---|
| Lithium carbonate | Widely used in lithium-ion batteries and pharmaceuticals. |
| Lithium hydroxide | Important for battery production, ceramics, and lubricants. |
| Lithium chloride | Utilized in air conditioning systems and as a catalyst in organic synthesis. |
| Butyllithium | An organolithium compound used in chemical reactions and as a polymerization initiator. |
| Lithium metal | Valuable for specialized applications, including lithium batteries and alloys. |
Usage
Different Lithium Battery Types
A variety of lithium-ion battery chemistries are fueling growing demand. Currently, six main types of lithium-ion batteries are commercially available, each designed to meet specific performance, safety, and application needs.
Main application |
Materials used |
Advantages |
|
|---|---|---|---|
| The Nickel Manganese Cobalt (NMC) | EV batteries, consumer electronics, energy storage | Lithium hydroxide/Lithium carbonate nickel, manganese, and cobalt | Higher energy density and faster charging performance in cold climates |
| Lithium Nickel Cobalt Aluminum oxides (NCA) | EV batteries | Lithium hydroxide, nickel, cobalt, aluminum | Higher energy density |
| Lithium Iron Phosphate (LFP) | EV and mobility batteries, energy storage | Lithium carbonate, iron, phosphorus | Longer life cycle, less thermal runaway risk and lower cost |
| Lithium Cobalt Oxide (LCO) | Smartphones, tablets, laptops, cameras and other handheld devices | Lithium carbonate, cobalt | High energy density, impressive cycle life, and reliability |
| Lithium Manganese Oxide (LMO) | Power tools, e-bikes, minimal EV applications | Lithium carbonate, manganese | Lower internal resistance and improved current handling. High thermal stability and enhanced safety |
| Lithium titanate (LTO) | Energy storage, industrial tools, electrical power trains | Lithium carbonate, titanium | Good thermal stability under high temperature |
Main application
Materials used
Advantages
Diverse Technologies for Lithium Extraction
The world of lithium extraction is evolving fast, as new technologies emerge to meet rising global demand for this critical mineral. Here’s a quick overview of the key extraction methods currently in use:
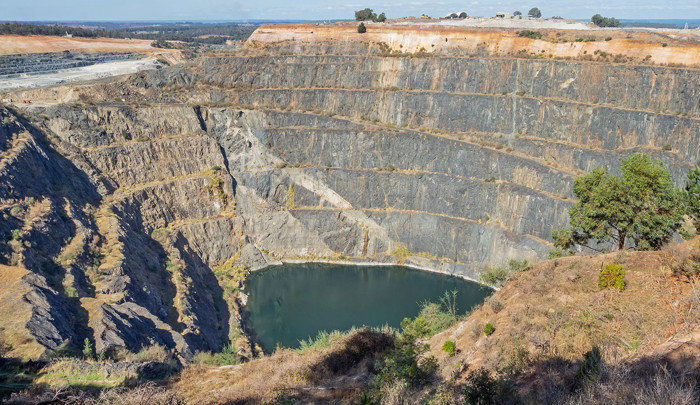
- Traditional hard rock mining: This method involves mining spodumene ore, which is then crushed and processed to extract lithium. It’s well-established but energy-intensive and can have significant environmental impacts.
- Brine evaporation ponds: This approach, commonly used in South America, involves pumping lithium-rich brine to the surface and allowing it to evaporate in large ponds. It’s more cost-effective than hard rock mining, but it requires vast land areas and long production timelines.
- Direct Lithium Extraction (DLE): DLE is a newer, more sustainable method that extracts lithium directly from brine using technologies like ion exchange and adsorption. It’s faster, uses less land and water, and leaves a smaller environmental footprint compared to evaporation ponds.
- Lithium extraction from oilfield wastewater and geothermal brine: Companies like Lithium Harvest are leading the way in extracting lithium from produced water in oilfields and geothermal brine. This breakthrough approach turns waste and byproducts into a valuable resource, highlighting a sustainable and cost-effective alternative to traditional methods.
Each method has its strengths and limitations. As lithium demand continues to rise, advancing more efficient, scalable, and environmentally friendly extraction technologies will be key to shaping the industry's future.
Technological Benchmark

Lithium Harvest Solution |
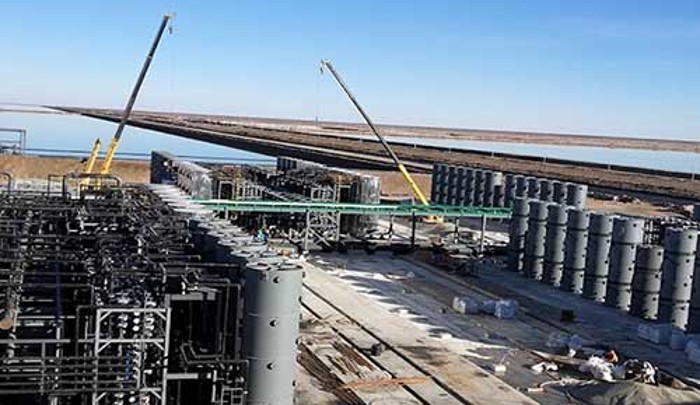
Traditional DLE |
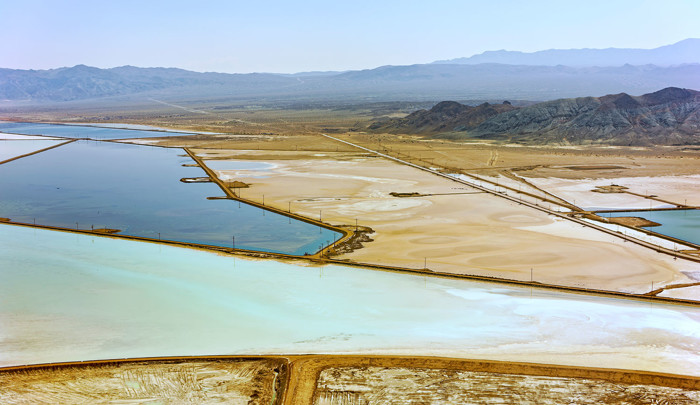
Solar Evaporation Brine Extraction |
Hard Rock Mining |
|
|---|---|---|---|---|
| Lithium feedstock | Produced water/geothermal brine | Continental brine | Continental brine | Rock / spodumene |
| Project implementation time | 12-18 months | 5-7 years | 13-15 years | 10-17 years |
| Lithium carbonate production time | 2 hours | 2 hours | 13-24 months | 3-6 months |
| Lithium yield | >95% | 80-95% | 20-50% | 40-70% |
| Average footprint per mt of LCE | 61 ft² | 172 ft² | 39,352 ft² | 3,605 ft² |
| Environmental impact | Minimal | Minimal | Soil and water contamination | Soil and water contamination |
| Freshwater consumption per mt of LCE | 22,729 gallons | 26,417 gallons | 118,877 gallons | 20,341 gallons |
| CO₂ footprint per mt of LCE | Neutral | 2.5 tonne | 3.1 tonne | 20.4 tonne |
| Average invested capital per mt of LCE | $17,100 | $62,500 | $34,000 | $60,000 |
| Average cost per mt of LCE | $3,647 | $6,000 | $6,400 | $7,000 |

Lithium Harvest Solution

Traditional DLE

Solar Evaporation Brine Extraction

Hard Rock Mining
Regulatory Tailwinds Are Real
Governments are moving fast on minerals security. Policies like the EU Critical Raw Materials Act and Canada’s Critical Minerals Strategy are unlocking grants, tax credits, faster permitting, and domestic-content incentives for low-impact lithium.
Want the specifics and what qualifies? See our overview of major programs, eligibility, and timelines.
Industry Outlook and Predictions
As we look to the future, several key trends and predictions point to a dynamic and promising outlook for the lithium market. Demand for lithium is expected to keep rising steadily, driven mainly by the electric vehicle (EV) and battery storage sectors.
The global shift toward clean energy, combined with growing adoption of electric vehicles (EVs) in response to climate concerns and government incentives, continues to fuel this surge. Lithium is set to remain a critical enabler of the green energy transition, powering innovations in transportation, energy storage, and beyond.

Lithium
You may also be interested in:


